Green Belts – A brief history
This history is adapted from a talk given at our AGM in March 2005.
Green Belts were necessary because London and other major cities kept on expanding. Something had to stop the countryside being concreted over. It has been said many times that once an open space has been built on it will almost certainly be lost forever.
We will illustrate the growth of London with some pictures and maps.
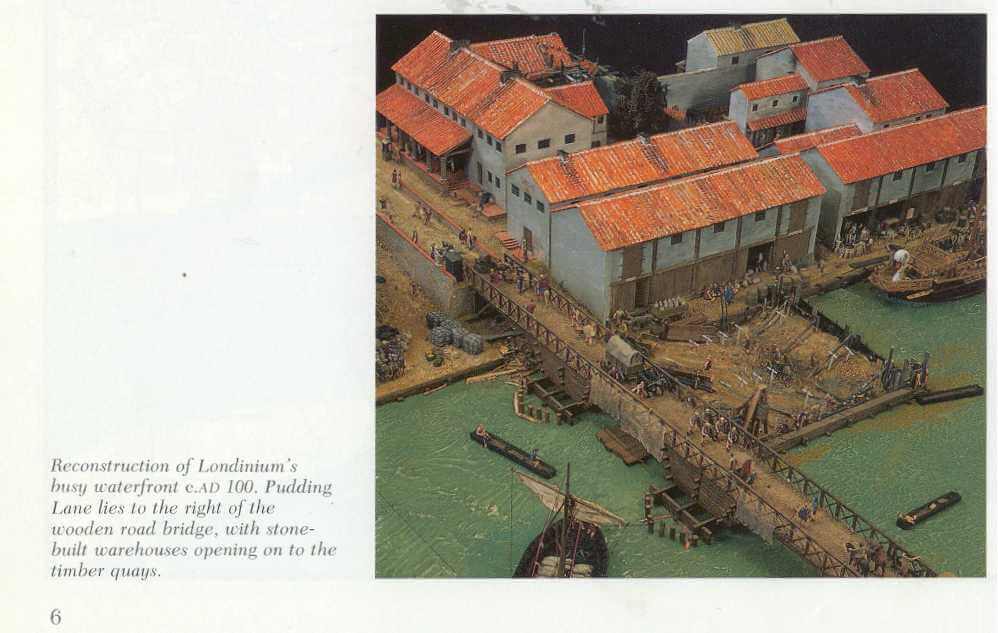
When the Romans invaded Britain for the second time in 43AD they needed a port on the Thames which was suitable for a bridge and was sufficiently upstream to weaken the effect of the tides. Londinium, as they called it, had gravel beds and fresh water available on the north bank, but the south side was prone to flooding. Our first picture shows a model of how the original London Bridge looked in Roman Times, about AD100.
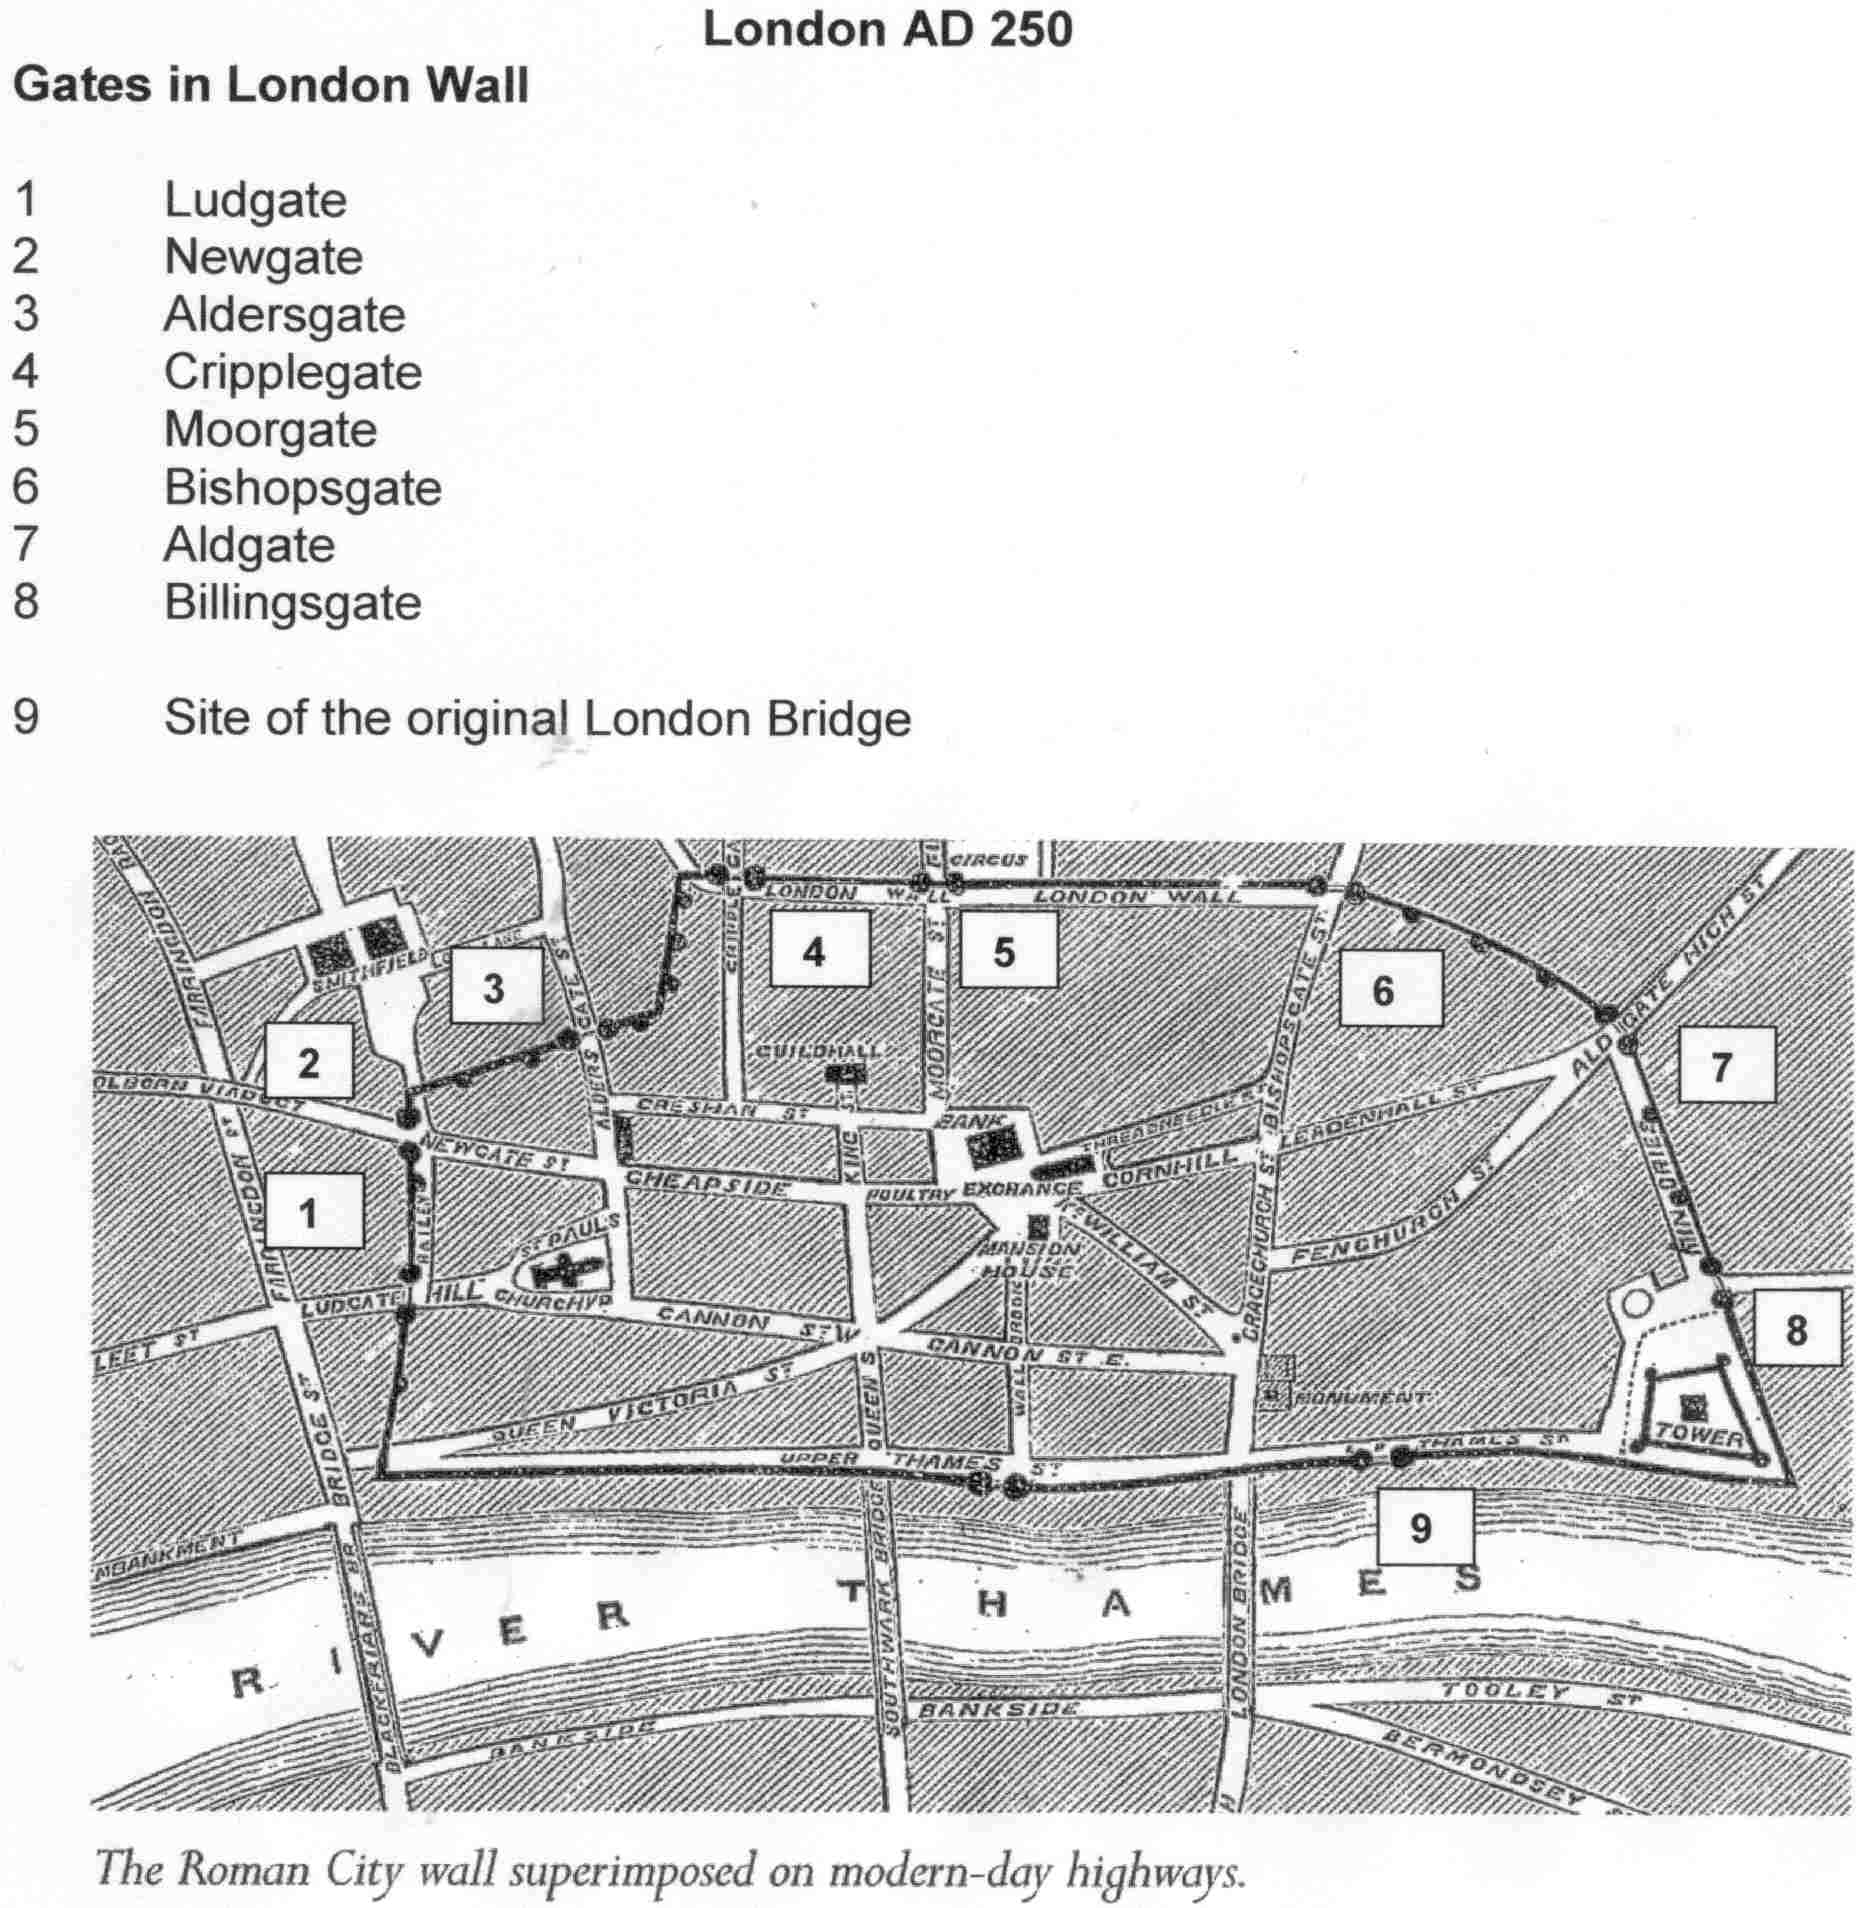
Roman London about the year 250AD. To protect the town from attack, the London Wall was built about 200AD surrounding the town except on the river frontage where it was built at a later date. The Romans occupied Britain until 410AD.
The wall was about 6 metres high and 3 metres thick with a ditch about 2 metres deep outside the wall. Note the River Fleet which now flows in a culvert or tunnel below Farringdon Street, and there is just one bridge over the river Thames.
The background to the picture is a street map of the roads today. Note the gateways in the wall. Until 1760 there were gates across the roads which could be closed. The gate to the bridge shows the location of the original London Bridge.
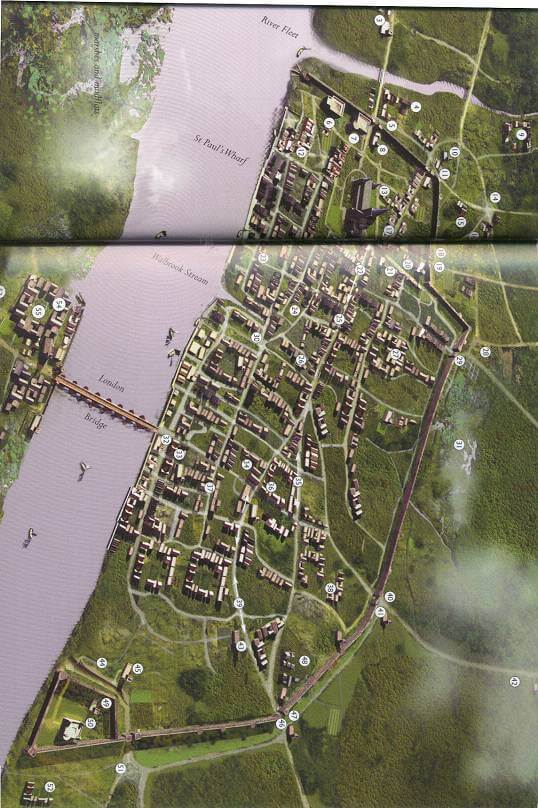
Moving on to 1200AD, London’s population was about 10,000 with very few houses outside London Wall. There was still only one bridge over the Thames, and there are open fields separating London from Westminster. The river Fleet on the left of the picture is just outside London Wall with Fleet Prison also just outside the wall.
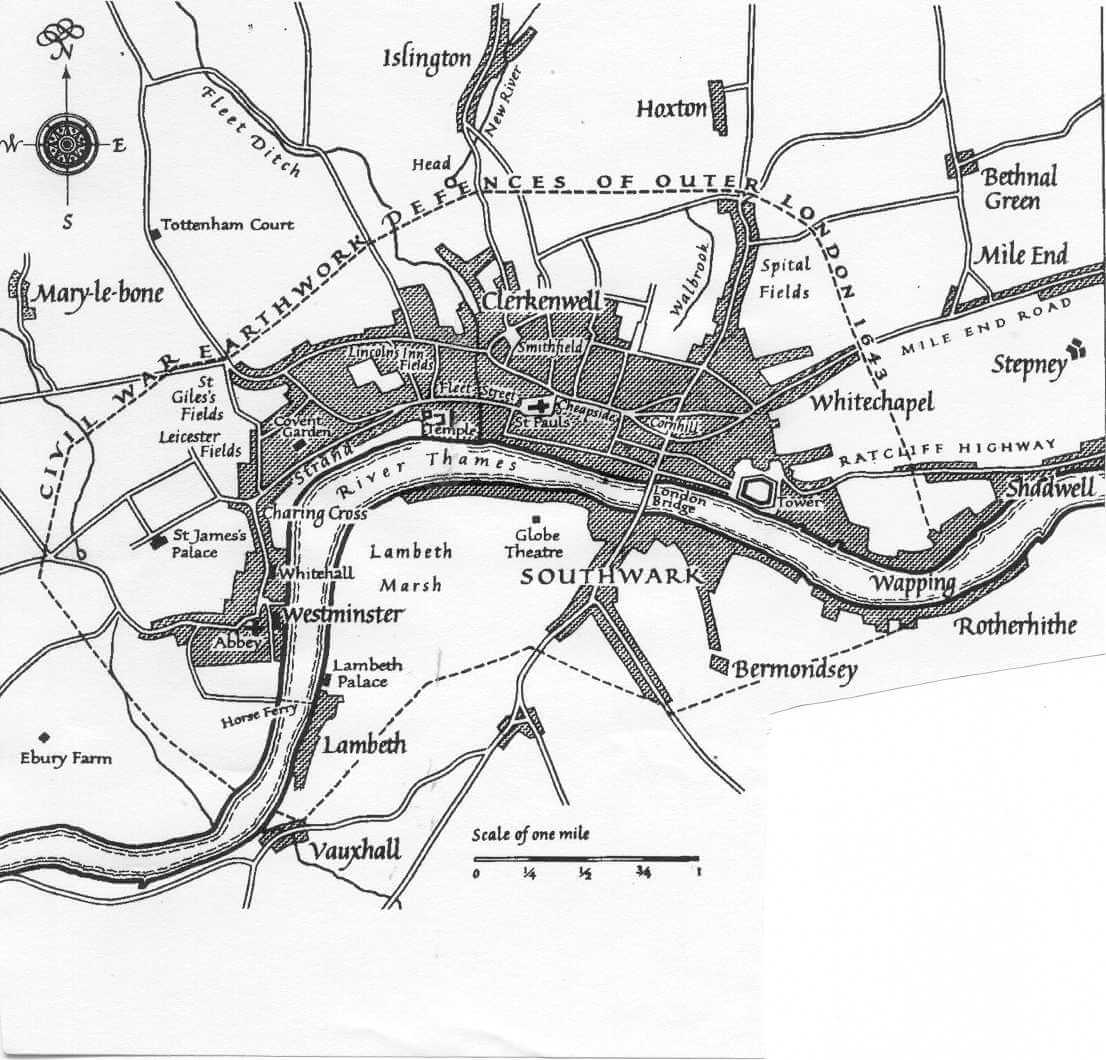
This shows London about the year 1600 in the late Tudor, early Stuart period. London had expanded beyond the wall, and the open fields had disappeared between London and Westminster. London’s population had grown from about 20,000 in the 1200s to 650,000 in the 1500s. This growth caused a major problem of supplying fresh water and the River Thames and numerous wells proved insufficient. In the 1600s the New River Co. was formed to bring water into London from springs in Hertfordshire to the reservoir at Clerkenwell. This New River still survives.
During the reign of Queen Elizabeth, a law was passed in 1592 prohibiting the erection of buildings on new foundations within 3 miles (5km) of any gate in London Wall. Using modern language, only brownfield developments were allowed within a ring three miles around London Wall. This was in effect a Green Belt.
No attempt was made to widen the roads in London even though they could not cope with the increasing volumes of traffic. Obviously they did not have someone like today’s Mayor of London, Ken Livingstone, or toll gates at the entrances to London, similar to today’s Congestion Charge. Even in those days there was also a problem of immigrants, and homeless people on London streets.
During the next 100 years to 1700 there had not been a lot of expansion. There was still only one bridge over the Thames. Travellers had to wait until 1750 for the second bridge which was at Westminster, and then 1769 for a third at Blackfriars. The gates in London Wall were removed in 1760 which helped relieve traffic problems.
Buckingham House (now Palace) was in open countryside. Also Hyde Park and Bloomsbury were outside the built-up area.
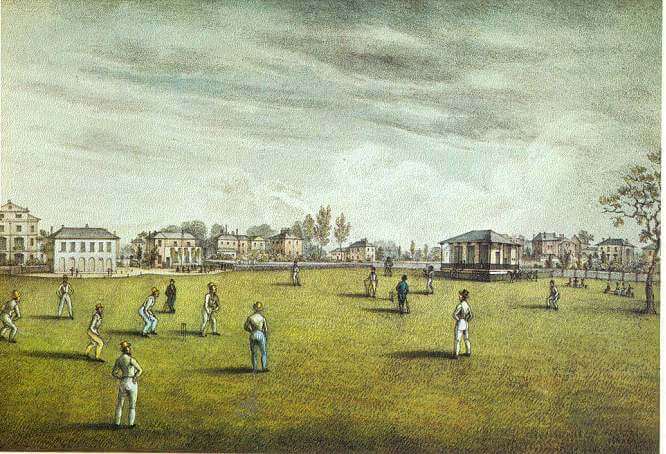
Moving on a 100 years, in 1830 the Lords Cricket Ground was a field and you can see the houses of St Johns Wood in the background. In 1820 William Corbett wrote of unchecked unorganised growth. He preferred small market towns such as Huntingdon with a population of 5,000. He said it was one of those pretty, clean, unstenched and unconfined places. It makes you wonder what life was like in London for him to make these comparisons.

London in 1845. Until now people lived near to where they worked, and did not travel far partly due to fear of highwaymen. The stagecoach was the main means of transporting people apart from travel on horseback, or on foot.
The invention of railways allowed people to travel safely and in larger numbers, so they could now live in one place and work somewhere else. The first railway line in the world opened in 1803 between Wandsworth and Croydon. A horse or mule pulled up to ten wagons on a railway track. This was 27 years before the first steam powered railway line in 1830 between Liverpool to Manchester.
You can see Regents Park where it says ‘Euston’ on the edge of London, and villages outside London included Acton, Highgate, Tottenham and Stratford
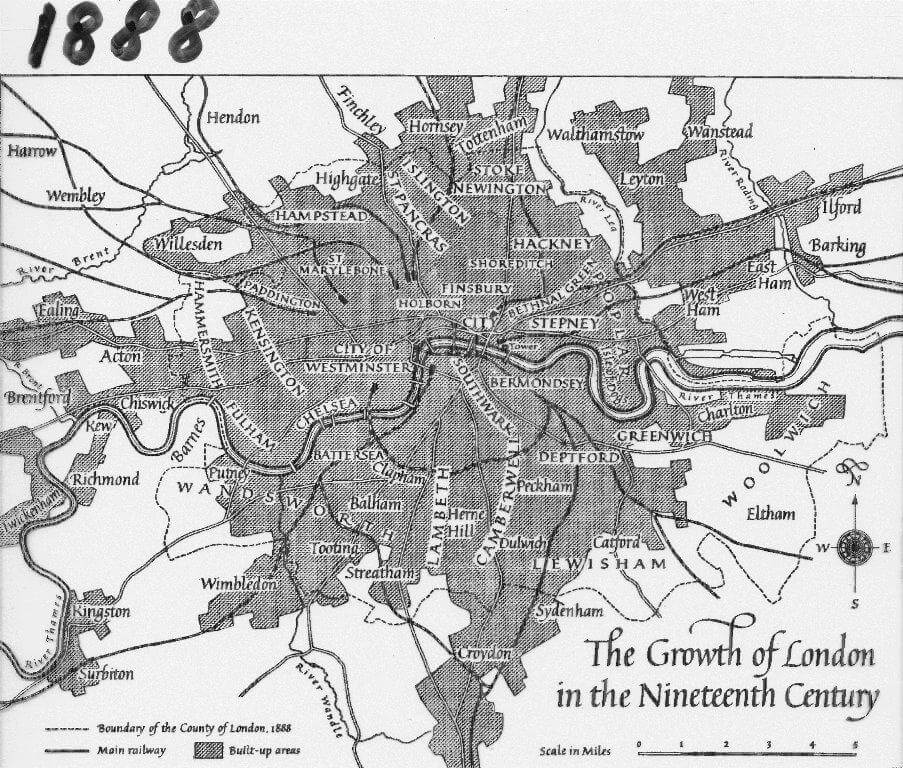
By 1888 the railways had enabled London to expand and all those villages had been absorbed into Greater London. The growth of London continued into the 20th century to include Wembley, Harrow, and Hendon.
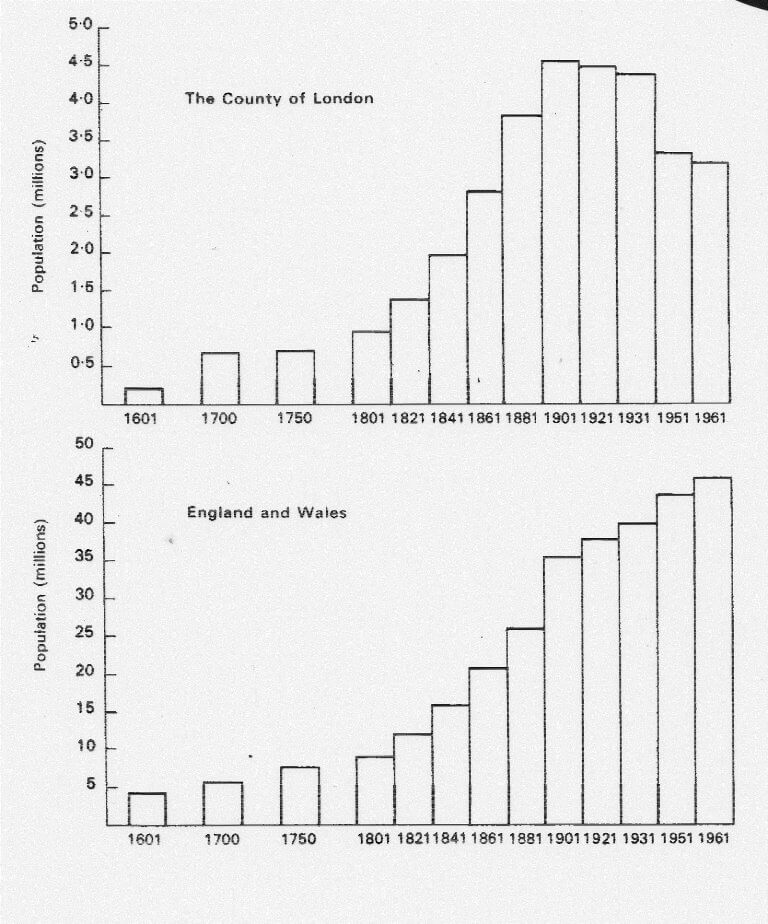
This shows the population growth of the County of London and also England and Wales. London’s population began to drop after 1901 when they started the slum clearance. In World War 2 many houses in London were destroyed, particularly in the East End because of the nearby docks. After the war eight New Towns were created outside the Metropolitan Green Belt including Stevenage, Harlow and Bracknell. This led to the huge drop in London’s population between 1931 and 1951. The figures are from the Census taken every ten years, which is why there are no figures for 1941 when we were at war.
Legislation
1600s Sir William Petty proposed a green belt 2 miles from centre of London
1910. Dame Henrietta Barnett (of Hampstead Heath fame) proposed a green belt 5 miles from central London
1935 London County Council Green Belt scheme
1938 Green Belt Act proposed a green ribbon round London
1944 Greater London Plan proposed a Green Belt Ring
1947 Town and Country Planning Act. This required County Councils to have 20-year development plans with a map indicating the Green Belt 7-10 miles round London. The County Plans had to be revised every 5 years.
1952 Town Development Act. This Act enabled the re-housing of Londoners in overspill towns outside the Metropolitan Green Belt at such locations as Letchworth, Chelmsford, Bletchley, Aylesbury, and Swindon.
1955 Green Belt policy codified, and extended beyond London
1988 Planning Policy Guidance Note (PPG2) – Green Belts was issued which set out the policies to be followed for Green Belts and developments in them
1995 PPG2 revised. This is the current guidance and can be seen on http://www.communities.gov.uk/ppg/ppg2
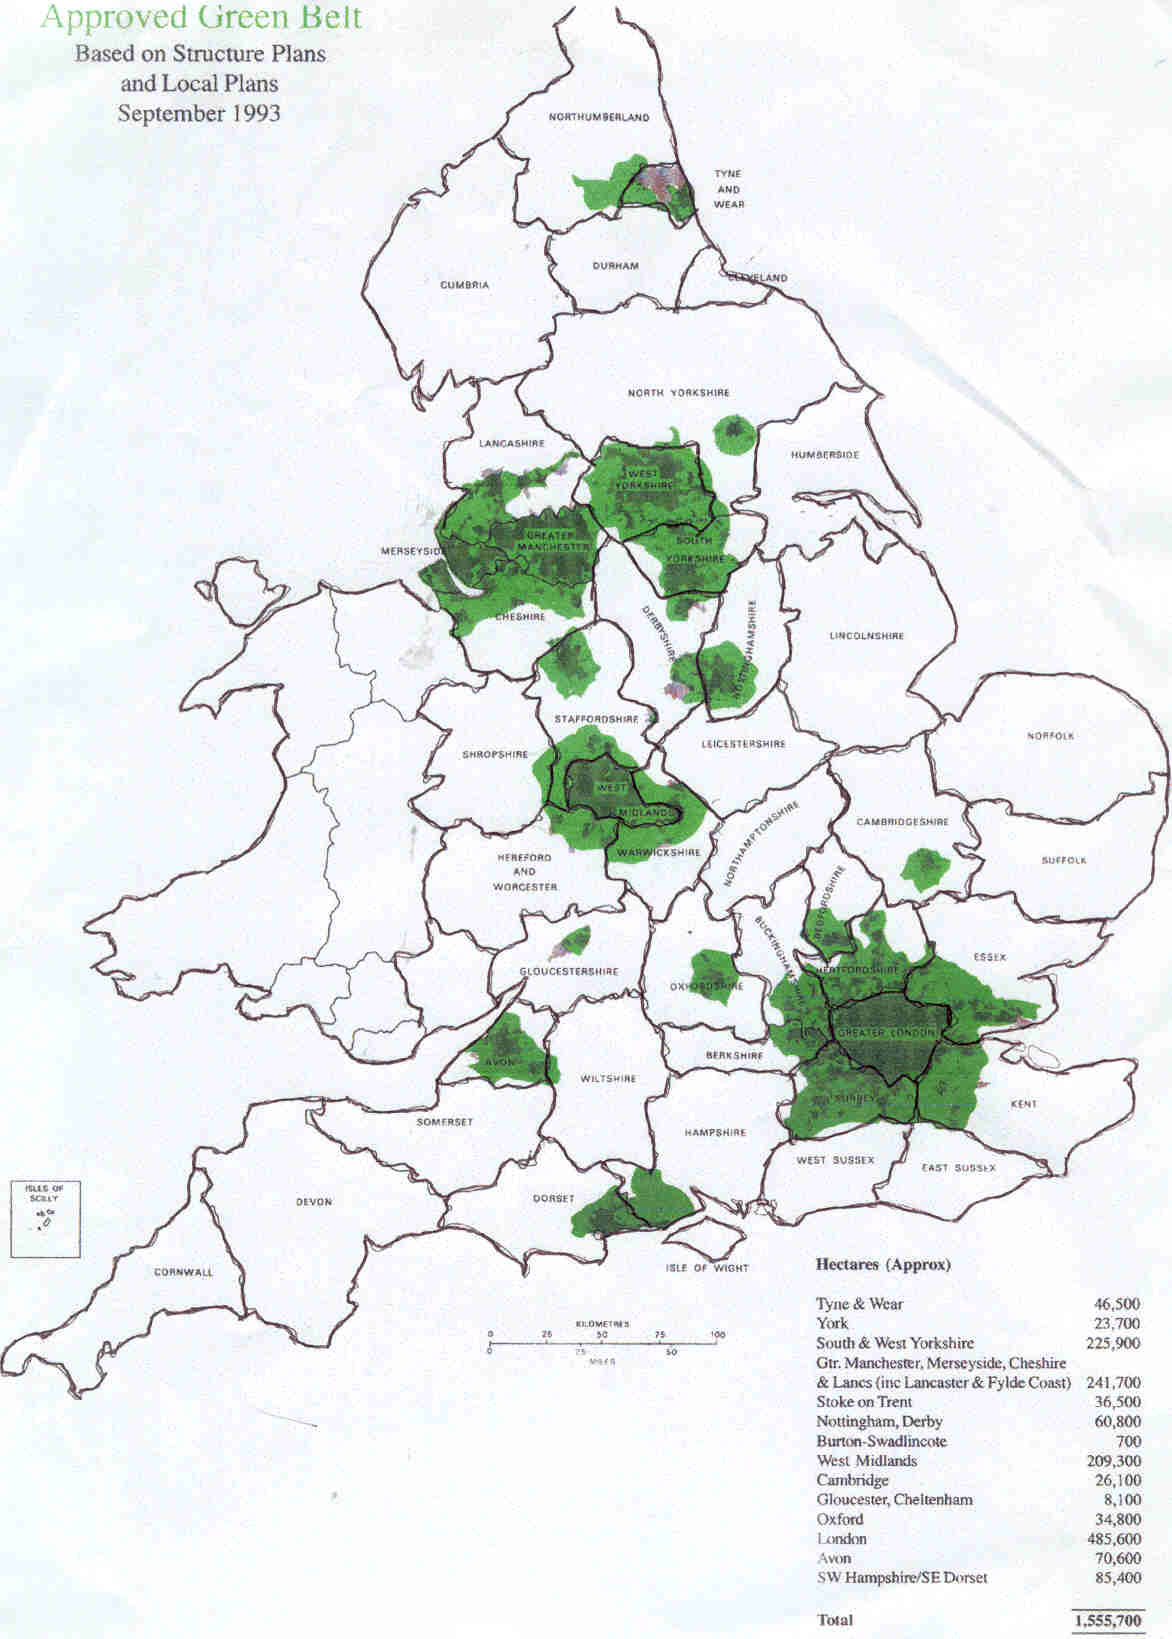
Map of England and Green Belts
There are 14 Green Belts in England. We do not have information about Green Belts in Scotland or Northern Ireland, but a Green Belt is proposed around the City of Cardiff. For more information search on www.Google.com for ‘Cardiff’.
Green Belt – purposes
There are five purposes of including land in Green Belts:
1 Check the unrestricted sprawl of large built-up areas
2 Prevent neighbouring towns from merging into one another
3 Assist in safeguarding the countryside from encroachment
4 Preserve the setting and special character of historic towns
5 Assist in urban regeneration by encouraging the recycling of derelict and other urban land
Dangers to Green Belt
1. Short term planning gain – over-riding the permanent nature of Green Belts by shifting the boundaries enabling towns to expand. The 2005 draft Milton Keynes and South Midlands Plan produced for the ODPM (Office of the Deputy Prime Minister) talks of shifting the Green Belt to enable existing towns to expand. See http://www.communities.gov.uk
2. Housing pressures. As an example, see East of England Plan section below. There is a similar picture for more housing in the South East of England (Kent, Surrey, Sussex etc) where the government is asking for 500,000 more houses.
3. London overspill. People who currently live and work in London and are finding it too expensive and too crowded to live in London which is reducing their quality of life. As a result, they are moving out of London to live in surrounding towns. This is increasing the pressures for more housing in the Home Counties
4. It is easier and cheaper to build on green field sites because brown field sites can be expensive to decontaminate
5. Inappropriate development which is not in accordance with PPG2, and reduces the openness of Green Belt land.
East of England Plan
The East of England Region comprises the counties of Norfolk, Suffolk, Essex, Cambridgeshire, Hertfordshire, & Bedfordshire.
The Plan proposes that between 2001 and 2021 there will be
421,500 new jobs
478,000 new homes more than doubling supply of affordable homes
More sustainable forms of transport by
– Reducing the rate of growth of car & lorry traffic
– promoting public transport, walking & cycling
East of England Plan – proposals for Hertfordshire
Currently the county has a population of just over 1 million living in 430,000 dwellings
The county is the most densely populated county in the country with 6.3 people per hectare (national average 3.4)
The population of the county is increasing due to people moving into it from London and from rest of country. It is a victim of its own success
95% of the county is covered by planning constraints, with 70% of the land is in the Metropolitan Green Belt
|
Hertfordshire traffic problems
Car ownership has grown enormously in the 40 years from 1951 to 1991. In that period, the population of Hertfordshire had less than doubled. However, the number of cars had grown from 40,000 to 450,000 – more than 5 times the rate of growth in population.
Car ownership is 24% higher than the national average
40% of households have two or more cars.
Traffic flows are 35% higher than the national average.
Traffic crossing the county is increased because of
– Commuters to London travelling by road and rail from areas beyond the county
– Travellers to and from Stansted and Luton airports, and going via the M25 to Heathrow and Gatwick airports.
– Channel Tunnel generated traffic to and from the rest of the country via the M25.
– Motorways generating through traffic – the M1, M11, A1(M), and M25
– Railways crossing the county going into the London terminals at Kings Cross and Liverpool Street.
– Feeder route traffic for the A14 heading to and from the seaports of Harwich and Felixstowe
Milton Keynes & South Midlands Strategy 2005-2021.
Issued 17 March 2005, it covers Milton Keynes, Northants, & parts of Beds and Bucks. It proposes 211,000 more houses
The strategy includes
– Concentration of 65,000 houses into six growth towns to avoid wasteful suburban sprawl
– protecting and improving the Green Belt (19,000 hectares added nationally since 1997). Review the existing Green Belt around Luton, Dunstable, Houghton Regis and Leighton Linslade.
Any land taken out of the Green Belt will be replaced.
Note the last sentence (our underlining). This goes against one of the basic features of Green Belts, namely their permanence. This is not a political point as such, but this government seems to be ignoring this basic reason for the creation of Green Belts. Green Belts are not there to be moved just to satisfy short term planning demands.
Quotation by Sir Winston Churchill – “We shape our environment and then our environment shapes us”.
Bibliography
‘London – the biography of a city’ by Christopher Hibbert, published by Longmans, Green & Co Ltd
‘The growth of London’ by Gillian Kinsey, published by B T Batsford Ltd
‘The annals of London – a year-by-year record of a thousand years of London’ by John Richardson, published by University of California Press (highly recommended reading if you can find it)
Census